Key Takeaways
- We drove a seven-stop pathology collection round with a tracker sealed inside a sample transport container
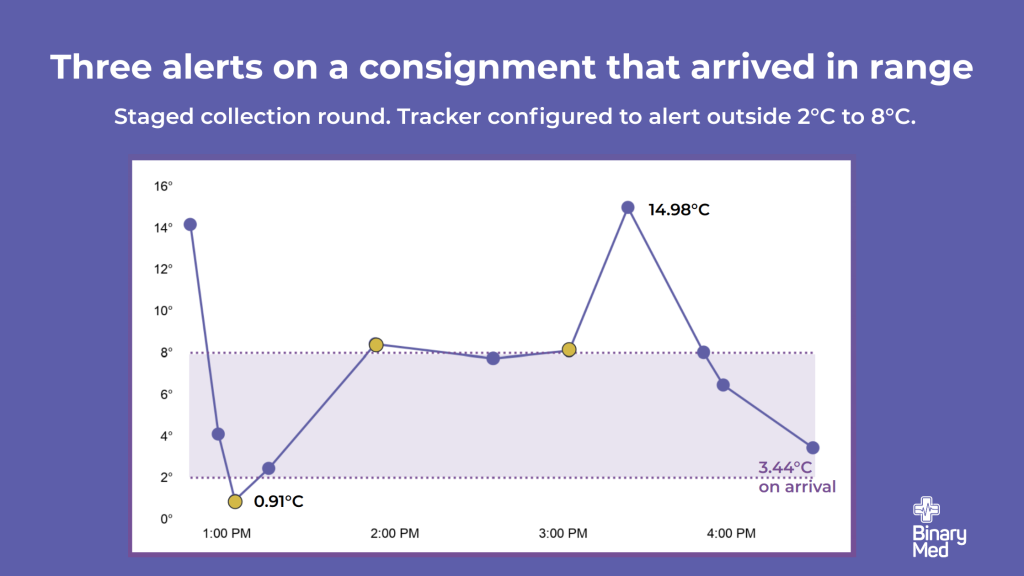
- The container left the 2°C to 8°C range three times and raised three alerts
- It arrived at 3.4°C, on time, and looked completely normal on receipt
- Without the tracker, none of that afternoon would have been recorded anywhere
Ask a laboratory where its risk sits and most people will point inwards, at the bench, the analyser, the reporting step. Those are the parts that are measured, audited and improved every year, which is precisely why that visibility becomes much less consistent before the sample reaches the laboratory.
The difficulty is earlier, in the stretch between a sample being collected and the moment it lands on the receipting desk. For most laboratories that stretch is not covered by any system they own. It often depends on manual records, handovers or retrospective enquiries.
At the point of receipt you know two things reliably: the consignment arrived, and when. What the samples experienced on the way is inferred from the fact that everything looks fine.
Most of the time that inference is correct. The difficulty is working out which times it was not, and usually working it out late, after a result has been reported or a clinician has already queried it. That is the pre-analytical blind spot, and it is the gap sample transport monitoring exists to close. ISO 15189:2022 has moved the expectation from assuming it was fine to being able to show it.
Why the pre-analytical phase is the hardest part to see
Research has consistently identified the pre-analytical phase as a major source of laboratory errors. This phase extends well beyond transport. It includes everything from test requesting and patient preparation to collection, labelling, handling and receipt. 1,2
A more recent laboratory study found that pre-analytical problems remain common, although reported rates vary considerably between settings and methodologies. 3
What has changed is not the science. It is the shape of the networks. Laboratories now run longer collection rounds, more collection sites and more third-party couriers than they did when those studies were first published, and every additional handover is a point where the record thins out.
It is also a phase in which laboratories may remain responsible for sample quality without having direct visibility over every stage of the journey. A sample sitting in a vehicle for 2 hours is the laboratory’s problem the moment a result is questioned, whether or not the laboratory had any way of knowing about it.
When visibility stops at the door, the consequences are practical:
- Deviations are discovered during retrospective review, if at all, rather than while there is still time to act.
- Investigations may require teams to reconstruct a timeline from people's memories and paper dockets.
- Recollection decisions are made on suspicion rather than evidence, which is expensive either way.
- Written procedures may be available even when evidence from an individual journey is limited
In a live poll during a recent webinar, 89% of the 27 people who answered said they had needed to produce evidence about what happened to a sample after the fact, more than once, in the past 12 months. 1 person said no.
The response illustrates the additional work that incomplete transport records can create. Every one of those investigations is someone’s afternoon spent rebuilding a record that was never captured.
Where the Laboratory Chain of Custody Actually Starts
If you draw a sample’s journey out, the gap becomes obvious.
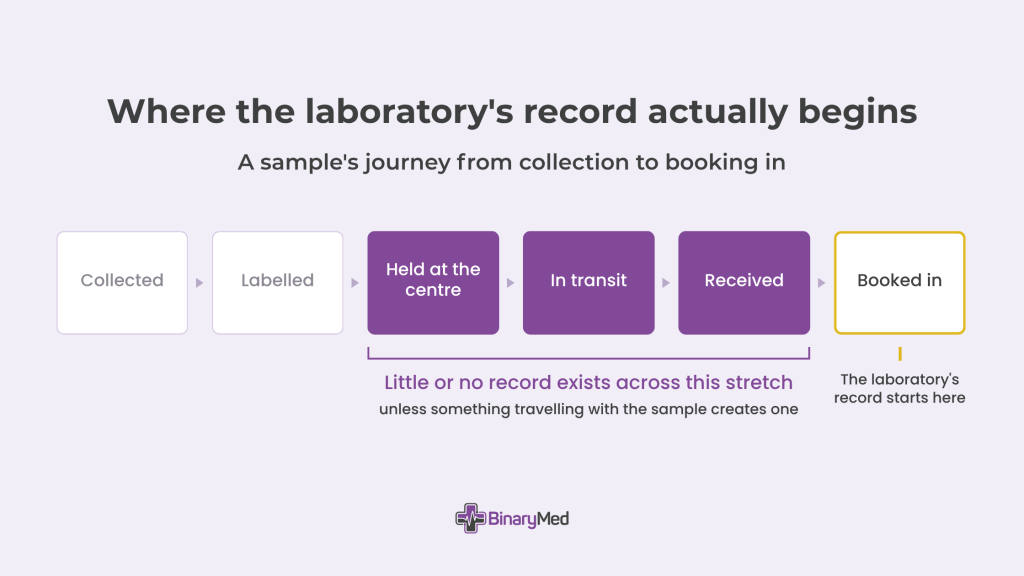
- A sample is collected, labelled and held at a collection centre.
- It is picked up, carried across a round with other stops, and delivered to the laboratory.
- It is receipted, booked in, and from that point, the laboratory’s own systems usually begin creating a much more detailed record.
The laboratory chain of custody, as a record anyone could actually produce, starts at booking in. Information from earlier stages may be spread across courier systems, paper records and individual handovers.
Sample visibility in transit is not missing because anyone decided it did not matter. The laboratory chain of custody has a gap in it because the systems on either side were each designed to cover only their own side.
We Drove the Round Ourselves
Rather than discuss the pre-analytical phase in the abstract, our team staged one.
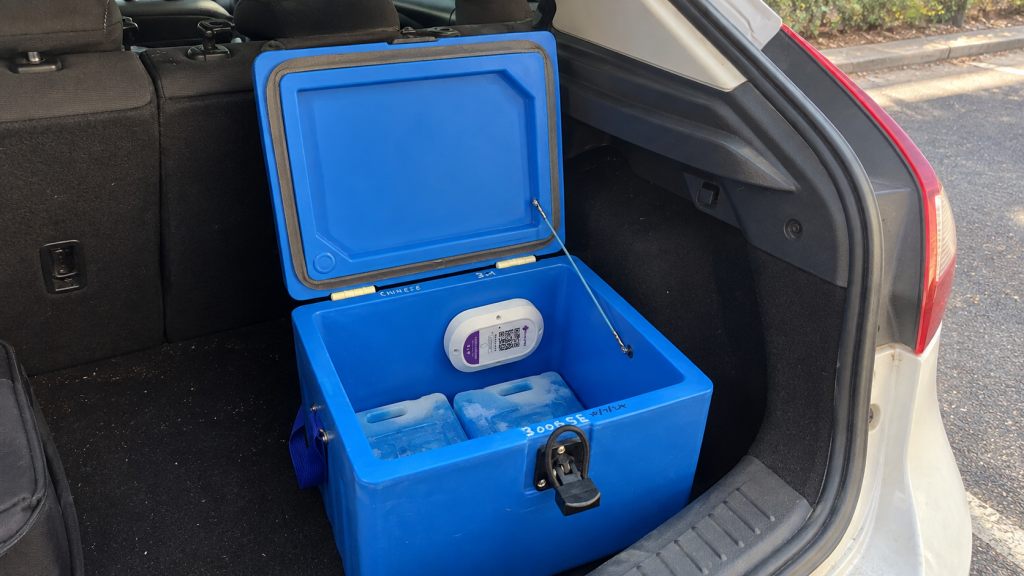
We packed a standard sample transport container with ice, placed a Cicada Voyager tracker inside it, and drove a 7-stop collection round across the Illawarra on an ordinary weekday afternoon. Real roads, real traffic, real timings, and an additional unplanned stop along the way.
The collection centres were simulated, but the route, timings, stops and tracker data were real. No patient samples were involved at any point. Sample transport temperature was logged continuously, with the tracker configured to alert outside 2°C to 8°C for this demonstration. That range suits many refrigerated specimens but is not a universal requirement, and validated ranges differ by sample type.
The container left the first stop in the early afternoon and reached the laboratory just before 16:30. By every measure a receiving laboratory would normally apply, it was an unremarkable afternoon.
What the Record Showed
Sample transport temperature across the afternoon
The container went outside the 2°C to 8°C range 3 separate times. The pattern is not the dramatic failure people picture when they imagine a cold chain breach.
- There was no refrigeration fault and no vehicle breakdown.
- There was ice doing less work as the afternoon went on, a lid opened at every stop, and a vehicle sitting in the sun.
- The highest reading of the run was just under 15°C, recorded in the second half of the afternoon between two stops.
- Roughly half an hour later the container was back inside range, and it stayed there.
- It arrived at the laboratory at 3.4°C.
What else the record missed
Without the tracker, a continuous record of the afternoon would not have been available.
- Not the excursions, but also not how long the container sat between stops.
- Not which leg of the round it spent longest on.
- Not the order the stops were actually done in.
Sample transport temperature is the part people notice, because it is measurable. The wider gap is the limited context available about the rest of the journey.
What the Arrival Record Would Have Shown
If that consignment had gone to a laboratory using ordinary receipting practice, the record would have read something like this:
Received 4:31pm. Condition on receipt: satisfactory.
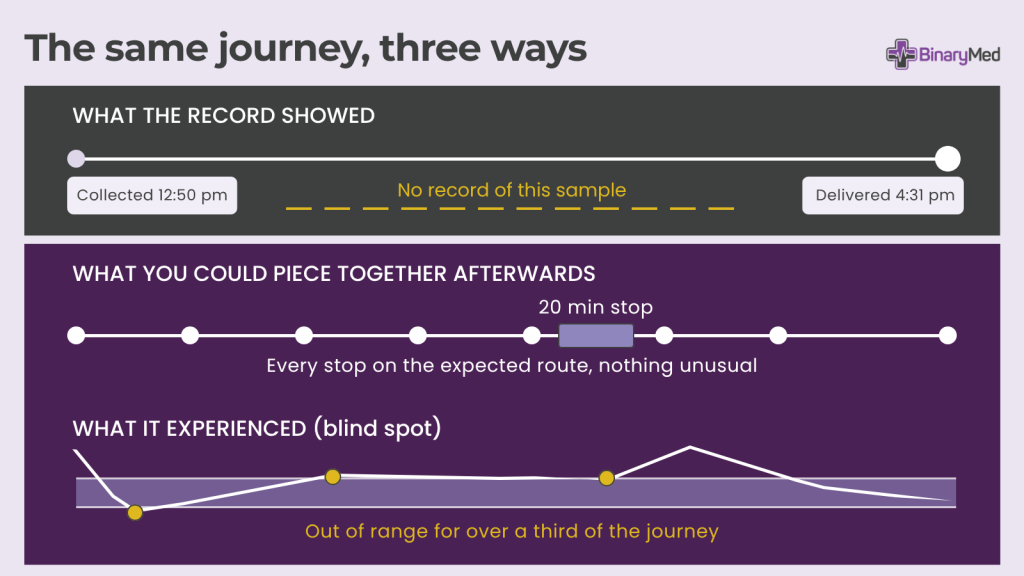
There is nothing wrong with that record. It is accurate. It is simply very thin, and it is thin in exactly the way that matters, because it describes the last 30 seconds of a 4-hour journey and says nothing at all about the other 3 hours and 59 minutes.
If a result from that run were queried three weeks later, the honest answer available to the laboratory would be that the sample arrived on time and looked fine. A laboratory chain of custody that begins at receipt cannot speak to what happened before receipt. That may not provide enough evidence to resolve the question confidently.
How Laboratories Approach Sample Transport Monitoring Today
Paper manifests and delivery dockets
Still the most common record of a handover.
Where it falls short: it records that a transfer happened, not what the samples experienced between transfers. It is also only as good as the handwriting and the person holding the clipboard.
USB and standalone data loggers
A genuine temperature record, and a real improvement on nothing.
Where it falls short: the data is retrospective and covers one variable. Someone has to collect the device, plug it in and review the file, which usually happens only when there is already a reason to suspect a problem. The excursions on our staged run would have been discoverable, but not until long after the samples were on the bench.
Courier tracking apps
Useful for knowing where a vehicle is.
Where it falls short: a vehicle’s position is not a sample’s condition, and courier systems are rarely designed to export into a laboratory’s quality records.
Connected monitoring that travels with the samples
Devices inside the container, transmitting continuously.
Why they are becoming the standard: the record exists before anyone needs it. A deviation generates an alert while the round is still running, and the same data becomes the audit trail afterwards without anyone assembling it.
Closing this visibility gap does not begin with choosing a sample transport monitoring system. It begins with understanding what information is currently available, where the record stops, and which questions the laboratory would struggle to answer after the fact.
Common Pitfalls in Sample Transport Monitoring
- Treating an on-time arrival as evidence of an uneventful journey. Our staged run arrived on time, in range, and had three excursions behind it.
- Solving only for sample transport temperature. It is the easiest variable to measure, which is why it tends to be the only one measured. Time, sequence and custody are just as often what an investigation actually turns on.
- Setting thresholds so tight that alerts become noise. If thresholds generate too many unnecessary notifications, alert fatigue can reduce their effectiveness.
- Collecting data nobody reviews. A monitoring programme needs an owner and a routine, not just devices.
- Assuming the problem belongs to the courier. Some of it does. Much of it is packing, ice quantity, lid discipline and round length, all of which are within the laboratory’s influence once they are visible.
ISO 15189 Pre-Analytical Phase Requirements
The ISO 15189 pre-analytical phase requirements reinforce the importance of defining and monitoring pre-examination transport conditions and maintaining appropriate records. 4 A continuous transport record can support that evidence, alongside the laboratory’s existing procedures, risk controls and quality management system.
Monitoring supports compliance. It does not create it. What sample transport monitoring provides is a record that transport conditions were defined and observed, that deviations were detected, and that both are retrievable without reconstruction.
It does not replace a laboratory’s own procedures or its clinical judgement about sample suitability. It gives those judgements something factual to rest on.
Evaluation Checklist for Sample Transport Monitoring
If you are assessing your own sample transport monitoring, these are the questions worth asking:
- For a sample that arrived yesterday, can you say what was happening to it two hours before it reached you?
- How long after a deviation would your team currently find out about it?
- If a clinician queried a result from three weeks ago, how long would assembling the transport history take, and who would do it?
- Does your record cover the time between collection sites, or only the moments of handover?
- Are your alert thresholds set per sample type, or one range for everything?
- Could you hand an auditor the transport record for a specific sample without preparing anything first?
Final Thoughts
A sample transport monitoring system should do more than record data. It should give you confidence that you will hear about a deviation while there is still time to act on it, and that a query about any sample has a factual answer rather than a reconstructed one. It should mean decisions about recollection are made on evidence rather than suspicion, and that your audit record exists before the audit is scheduled.
The staged run was valuable precisely because the journey appeared routine. An ordinary afternoon, an ordinary transport container, an on-time arrival, several events that may otherwise have remained invisible to the receiving laboratory.
See the Full Staged Run
We walked through the entire afternoon in our webinar The Sample You Can’t See. Watch the recording.
To talk about any of this against your own collection rounds, book a demo with BinaryMed or email us at [email protected].
FAQ: The Pre-Analytical Blind Spot
It is the stretch of a sample's journey between collection and arrival at the laboratory, where no system the laboratory owns is recording anything. The laboratory's own record typically begins at booking in, so everything before that point has to be reconstructed after the fact if it is ever needed.
Because it involves the most people, the most handovers and the least instrumentation. It also spans a wide range of activity, from test requesting and patient preparation through collection, labelling, handling and transport, much of which happens outside the laboratory’s direct supervision. Reported error rates vary considerably between studies and settings.
No. Temperature is the variable most often monitored because it is the easiest to measure. Time, sequence and custody are just as often what an investigation turns on, and those are usually not recorded at all.
A transport container recovers. Once the lid is closed and the vehicle cools, the internal temperature drops back into range. An arrival reading tells you about the arrival, not about the hours before it, which is why sample transport temperature has to be recorded continuously rather than checked at the door.
They close part of it. Data loggers produce a temperature record, and many laboratories use them as part of a compliant process. The limitation is that the data is retrospective and single-variable, so deviations are found during review rather than while they can still be acted on. Continuous sample transport monitoring closes the remaining gap.
Not with a connected device. The Cicada Voyager transmits from wherever it is, so there is no gateway, scanner or installation required at individual sites. The tracker travels with the samples.
Contractually it varies. Practically, the laboratory is the party that has to answer for sample integrity, which is why holding its own laboratory chain of custody rather than relying on the courier’s matters.
References
- Plebani M. Errors in clinical laboratories or errors in laboratory medicine? Clin Chem Lab Med. 2006;44(6):750-759.
- Carraro P, Plebani M. Errors in a stat laboratory: types and frequencies 10 years later. Clin Chem. 2007;53(7):1338-1342.
- Alcantara JC, Alharbi B, Almotairi Y, Alam MJ, Muddathir ARM, Alshaghdali K. Analysis of preanalytical errors in a clinical chemistry laboratory: a 2-year study. Medicine (Baltimore). 2022;101(27):e29853.
- International Organization for Standardization. Medical laboratories: requirements for quality and competence. ISO 15189:2022. Published December 2022.